 By Anton Lang ~
This Post details the daily wind power generation data for the AEMO coverage area in Australia. For the background information, refer to the Introductory Post at this link.
Each image is shown here at a smaller size to fit on the page alongside the data for that day. If you click on each image, it will open on a new page and at a larger size so you can better see the detail.
Note also that on some days, there will be a scale change for the main wind power image, and that even though images may look similar in shape for the power generation black line on the graph when compared to other days, that scale (the total power shown on the left hand vertical axis) has been changed to show the graph at a larger size to better fit the image for that graph.
Tuesday 14 September 2021
Total Wind Power Generation
 This image shows the total power generated across the whole day by every wind plant in this vast AEMO coverage area for Australia.
The total Nameplate for all these wind plants changes as each new wind plant comes on line delivering power to the grid. That current Nameplate is 8587MW, and this is from the current total of 69 wind plants.
Note that the shape of this wind power load curve does not follow the shape of the main load curve for total power generation, and that is seen in the image below, the solid black line across the top of the image for that graph. Wind power generates its power only when the wind is blowing, hence it does not follow the actual power generation Load Curve, which is also the the exact same shaped curve as for actual power consumption.
For this data, I have added the times for the daily minimum, and the daily maximum, to show how they do not correlate with the actual times of minimum power consumption (around 4AM each day) and maximum power consumption, the evening Peak. (at around 6.40PM in Winter and earlier during the Summer Months.)
Daily Minimum – 366MW (1.05PM)
Daily Maximum – 1930MW (9.15PM)
Average Wind Generation – 1236MW
Total Generated Power – 29.66GWH
Percentage Supplied By Wind Power At The Low Point For The Day – 1.5%
Percentage Supplied By Wind Power At Peak Power For The Day – 1342MW of 28010MW – 6.35PM – 4.79%
Average Percentage Of Overall Total Power Generation – 5.2%
Daily Operational Capacity Factor – 14.39%
Wind Power Generation Versus Total Power Generation
 This image shows the total power generated from all the wind plants in this AEMO coverage area, and compares it to the overall total generated power from every source of power generation, which is the black line at the top of the graph. Wind power is the green coloured area, along the bottom of this graph.
While the green colour in this image looks to be a different shape to the graph above, keep in mind here that the scale is completely different, and that green coloured Wind total is the same as for the image shown above, only with the scale changed so it can fit onto the graph.
Notes
- Finding Wind Power Average – On the graph, there are 25 hourly time points, starting with midnight and finishing with midnight. I have added the total at each of those hourly time points together, and divided the resultant total by 25 to give an average in MegaWatts. (MW)
- For total power in GWH, multiply the average daily power by 24, and then divide by 1000.
- For the Capacity Factor, that is calculated by dividing the average wind generation by the current Nameplate and then multiplying that by 100 to give a percentage.
Comments For This Day
With that large high pressure Weather system in the South of the Continent, wind conditions were almost non existent, and because of that wind generation was way down on this day. The daily average for this day was only 1236MW, and that gave wind generation a daily operational Capacity Factor of just 14.4%, and that was sixteen percent less than the year round average, lower even than half that average. Even on a day like this when wind generation was so low, you can see that the difference between the low for the day and the high was still substantial, and that gap came in at 1564MW, so the variation across the day amounted to a change of 81%. While it was in a climbing phase from the afternoon onwards, it was still low at the usual time of the evening Peak for overall power consumption, and at that time, wind was delivering just 4.8% of all the generated power.
 I mentioned above that area where the majority of Wind Plants are located, and that is the South Eastern part of the State of South Australia and Central Western Victoria. In that area there are forty seven wind plants with a total Nameplate of 5250MW, and that’s 61.2% of all the wind generation in Australia, and this was the same area where that large High Pressure weather system was located during this day.
(If you click on the image itself, it will open on a new page and at a much larger size, so you can better see the detail)
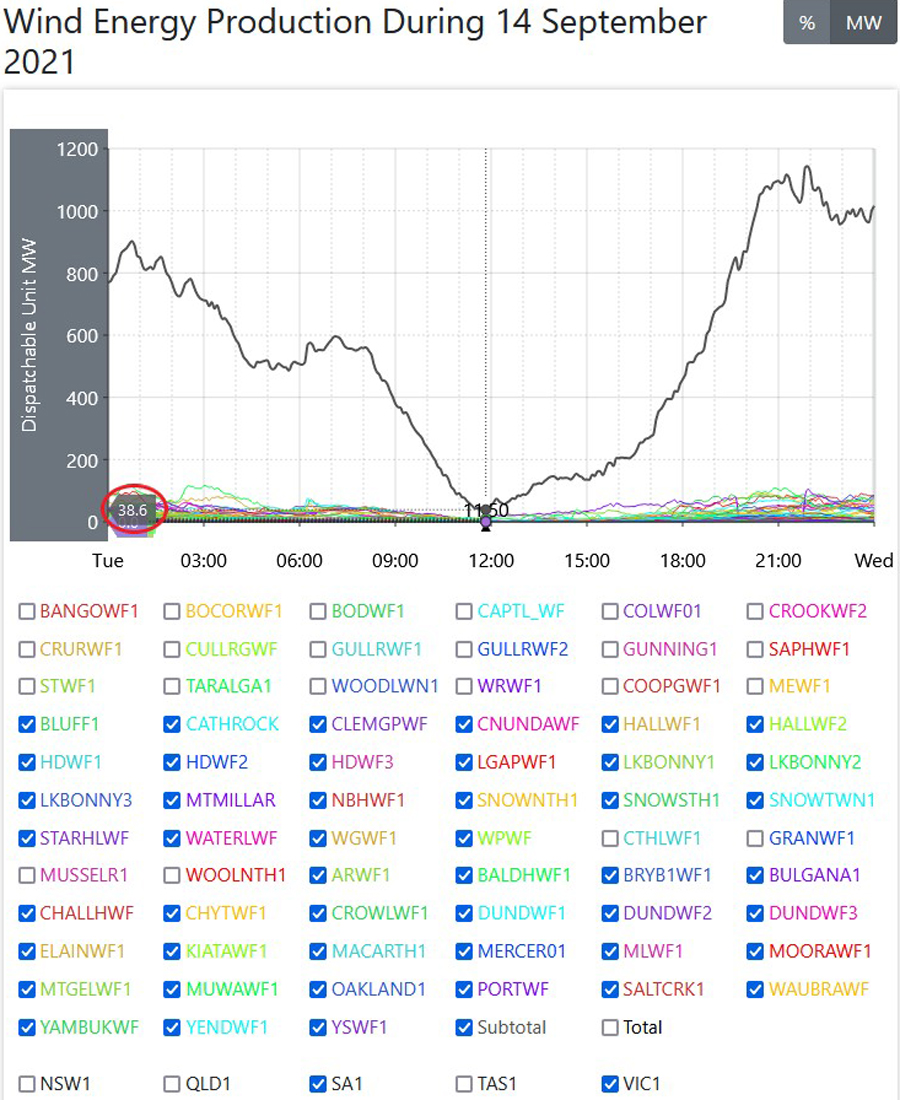
That image at right shows the total generated power from just those 47 wind plants across the whole day, and as you can see, it fell away more than shown on the overall generation shown at that top graph on this page. As you can see at the bottom of this image, I have just ticked the boxes showing just those two States, SA and Vic, and the blue ticked boxes above that show the 47 wind plants. What I have also done is to indicate the time of the lowest power generation, here shown at 11.50AM. If you then move across to the left vertical scale, it indicates the total power being delivered from those 47 wind plants, and here, I have circled that total in red, and that total at that time was just 38MW. So, with a total Nameplate of that 5250MW, then the delivered power of 38MW gave wind generation in that area at that time of just 0.72%. So, that’s around 2600 wind towers in all, and only 20 at most actually had their blades turning and generating power at that time. The overall total power being consumed at that same time in those two States was 7700MW, so wind was delivering 0.49% of all that power, less than HALF OF ONE PERCENT.
So, here we have 61.2% of all the wind generation in Australia, and it drops away to virtually nothing when the wind fails across this large area. It sort of dispels the myth of the wind always blowing somewhere, and if more of them are constructed, then these low periods will not have as much effect.
This proves the opposite in fact, and there are many more wind plants proposed, and some already under construction in this same area.
*****
Anton Lang uses the screen name of TonyfromOz, and he writes at this site, PA Pundits International on topics related to electrical power generation, from all sources, concentrating mainly on Renewable Power, and how the two most favoured methods of renewable power generation, Wind Power and all versions of Solar Power, fail comprehensively to deliver levels of power required to replace traditional power generation. His Bio is at this link.
OzWindPowerGenerationTFO


Posted on Wed 09/15/2021 by TonyfromOz
0