 By Anton Lang ~
This Post details the daily wind power generation data for the AEMO coverage area in Australia. For the background information, refer to the Introductory Post at this link.
Each image is shown here at a smaller size to fit on the page alongside the data for that day. If you click on each image, it will open on a new page and at a larger size so you can better see the detail.
Note also that on some days, there will be a scale change for the main wind power image, and that even though images may look similar in shape for the power generation black line on the graph when compared to other days, that scale (the total power shown on the left hand vertical axis) has been changed to show the graph at a larger size to better fit the image for that graph.
Wednesday 28 April 2021
Total Wind Power Generation
 This image shows the total power generated across the whole day by every wind plant in this vast AEMO coverage area for Australia.
The total Nameplate for all these wind plants changes as each new wind plant comes on line delivering power to the grid. That current Nameplate is 8132MW, and this is from the current total of 67 wind plants.
Note that the shape of this wind power load curve does not follow the shape of the main load curve for total power generation, and that is seen in the image below, the solid black line across the top of the image for that graph. Wind power generates its power only when the wind is blowing, hence it does not follow the actual power generation Load Curve, which is also the the exact same shaped curve as for actual power consumption.
For this data, I have added the times for the daily minimum, and the daily maximum, to show how they do not correlate with the actual times of minimum power consumption (around 4AM each day) and maximum power consumption, the evening Peak. (at around 6.40PM in Winter and earlier during the Summer Months.)
Daily Minimum – 288MW (12.35PM)
Daily Maximum – 1303MW (12.35AM)
Average Wind Generation – 732MW
Total Generated Power – 17.56GWH
Percentage Supplied By Wind Power At The Low Point For The Day – 1.2%
Percentage Supplied By Wind Power At Peak Power For The Day – 809MW of 26400MW – 6.15PM – 3.06%
Average Percentage Of Overall Total Power Generation – 3.1%
Daily Operational Capacity Factor – 9.00%
Wind Power Generation Versus Total Power Generation
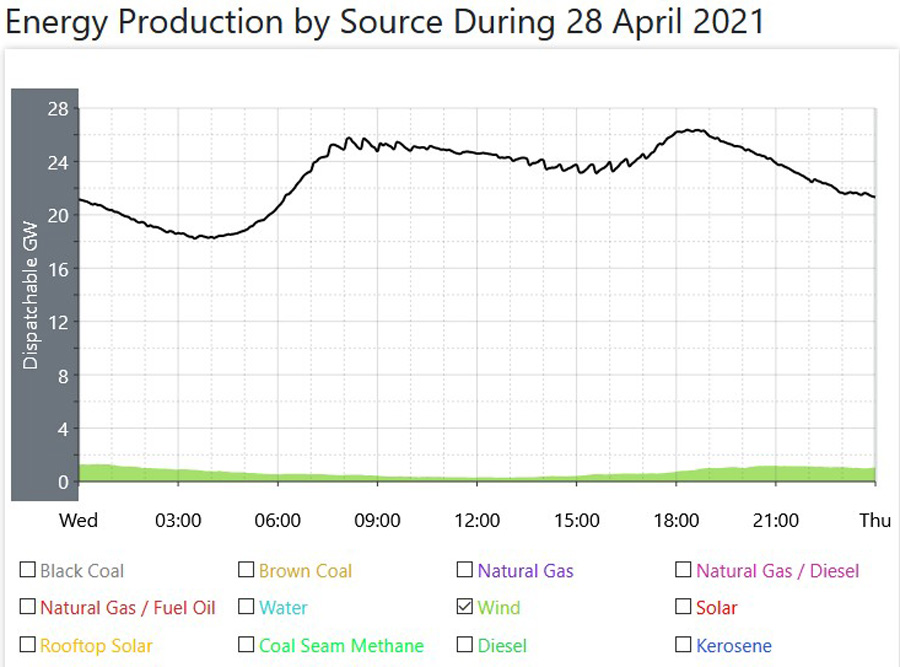 This image shows the total power generated from all the wind plants in this AEMO coverage area, and compares it to the overall total generated power from every source of power generation, which is the black line at the top of the graph. Wind power is the green coloured area, along the bottom of this graph.
While the green colour in this image looks to be a different shape to the graph above, keep in mind here that the scale is completely different, and that green coloured Wind total is the same as for the image shown above, only with the scale changed so it can fit onto the graph.
Notes
- Finding Wind Power Average – On the graph, there are 25 hourly time points, starting with midnight and finishing with midnight. I have added the total at each of those hourly time points together, and divided the resultant total by 25 to give an average in MegaWatts. (MW)
- For total power in GWH, multiply the average daily power by 24, and then divide by 1000.
- For the Capacity Factor, that is calculated by dividing the average wind generation by the current Nameplate and then multiplying that by 100 to give a percentage.
Comments For This Day
On this day, wind generation was even lower than the really low level of the day before. That daily average of 732MW gave wind generation a daily operational Capacity Factor of just 9%, arguably the lowest it has been since I started taking these records. It has been lower, but not by much and only three times lower than this over these last 800+ days I have been keeping these daily records, and on each of those occasions, the total Nameplate for wind generation has been a lot lower than this level of 8132MW. At the low point for the day, wind generation was only delivering 1.2% of all the generated power, and at the daily peak at 6.15PM, just 3.1%.
That daily average meant that less than one in every ten of the more than 4000 individual wind towers actually had their blades turning over and generating any power at all.
*****
Anton Lang uses the screen name of TonyfromOz, and he writes at this site, PA Pundits International on topics related to electrical power generation, from all sources, concentrating mainly on Renewable Power, and how the two most favoured methods of renewable power generation, Wind Power and all versions of Solar Power, fail comprehensively to deliver levels of power required to replace traditional power generation. His Bio is at this link.
OzWindPowerGenerationTFO


tygrus
Thu 04/29/2021
What is important is the performance compared to the typical 30% capacity. What would happen if we had enough wind turbines to meet 100% of demand after removing solar PV? How much pumped hydro, batteries or similar storage would be needed to support the fluctuations over seconds, minutes, hours & days time scales? Or how reliant on coal/gas would we be during those times.
Compare the wind turbine generation to the 30%, as the 100% (2400 MW generation is 100% on the new graph). You see 360 MW would be 15% of avg, 4800 MW would be 200% of avg (30%*8000=2400). You would need to park turbines(or disconnect), store or waste the excess when generation exceeds demand. How do we survive a week of 150% and a week of 50%? Multiple weeks above 100% then months later multiple weeks below 100%?
The installed wind maximum capacity (8132 MW) is nowhere near the typical demand (20’000 MW) & the typical target of 30% capacity factor is much less than that. Don’t bother comparing the current wind with total demand. Please compare wind generation with its 30% capacity.
The grid connections & transmission are required to handle 100% of the nameplate capacity but sometimes sit near idle with an average of 30%. How does that compare to coal ranging from 50% to 100% with 70% average? Having extra capacity costs more. Renewables blame the old grid for new problems created by renewables. Let’s be honest about cause & effect. Renewables should be forced to have or contract sufficient backup for a minimum generation (eg. 25% of nameplate) and pay most of the required grid upgrades (eg. 65% upgrades of interstate grid interconnections & 90% of upgrades to connect the new green zones). It’s perplexing that the “gold plated upgrades” of the last 2 decades are now undersized for future generation & usage patterns (min/peak solar/wind, EV super charging & population growth). If you look at the averages, the capacity seems wasted but it’s not. The minimum, maximum & averages are now much further apart, it’s obvious the costs per kWh will increase.
LikeLiked by 1 person
TonyfromOz
Fri 04/30/2021
tygrus,
thanks for making these very good points.
For so long now, I have been watching as each new wind plant proposal is released. One of the things I have noticed is that they, virtually all of them say that (and how lucky is this) the infrastructure to get the power to where it is being consumed, those huge Transmission lines are really close by, and they can just feed straight into them. You sort of wonder just how many of these wind plants are already hooked up to those nearby transmission lines. Gives a whole new concept on why so many wind plants are being constructed in and around the one area in Central Western Victoria, and in the South East of South Australia.
It will be a whole new ball game when the grid operators tell a new wind plant that those Transmission lines are already at Capacity, and they will need to construct their own new Transmission lines.
It also sort of makes you wonder why those transmission lines in South Australia all came down causing that State to go black a few years back now. Maybe they built their own Transmission lines on the cheap.
Again, thanks for dropping by and leaving a comment. Much appreciated.
Tony.
LikeLiked by 1 person